Table of Contents
ToggleBest Marketing Dashboard Analytics:Word Guide for Data-Driven Growth (2026)
In today’s digital-first world, marketing without data is like driving blindfolded. Businesses generate massive amounts of data across multiple channels—SEO, social media, paid ads, email, and more. But raw data alone isn’t useful unless it’s organized, visualized, and actionable.
That’s where marketing dashboard analytics comes in.
A marketing dashboard provides a centralized view of all your key performance indicators (KPIs), helping you make smarter decisions, optimize campaigns, and maximize ROI. In this comprehensive guide, we’ll explore the best marketing dashboard analytics tools, strategies, features, and best practices to help you scale your business in 2026.
1. What is Marketing Dashboard Analytics?
A marketing dashboard is a visual tool that displays real-time data from various marketing channels in one place.
Key Functions:
-
Track performance metrics
-
Visualize data through charts and graphs
-
Monitor campaigns in real-time
-
Identify trends and opportunities
Example:
Instead of checking multiple platforms, a dashboard shows:
-
Website traffic
-
Ad performance
-
Conversion rates
-
Social engagement
—all in one interface.
2. Why Marketing Dashboards Are Important
1. Centralized Data
View all marketing data in one place.
2. Better Decision-Making
Data-driven insights improve strategy.
3. Real-Time Monitoring
Track performance instantly.
4. Improved ROI
Optimize campaigns based on insights.
5. Time Efficiency
No need to switch between tools.
3. Key Metrics to Track in Marketing Dashboards
Website Metrics
-
Traffic (users, sessions)
-
Bounce rate
-
Session duration
SEO Metrics
-
Keyword rankings
-
Organic traffic
-
Backlinks
Paid Ads Metrics
-
Cost per click (CPC)
-
Conversion rate
-
Return on ad spend (ROAS)
Social Media Metrics
-
Engagement rate
-
Followers growth
-
Reach & impressions
Email Marketing Metrics
-
Open rate
-
Click-through rate (CTR)
-
Conversion rate
4. Best Marketing Dashboard Analytics Tools
Here are the top tools used globally:
1. Google Analytics
-
Tracks website traffic and user behavior
-
Free and widely used
-
Powerful insights for SEO and performance
2. Google Looker Studio
-
Custom dashboards
-
Integrates with multiple data sources
-
Ideal for reporting
3. HubSpot
-
All-in-one marketing dashboard
-
CRM integration
-
Great for inbound marketing
4. Tableau
-
Advanced analytics
-
Interactive dashboards
-
Enterprise-level solution
5. Power BI
-
Business intelligence dashboards
-
Real-time analytics
-
Strong integration with Microsoft tools
6. SEMrush
-
SEO and competitor analysis
-
Keyword tracking
-
Marketing insights
7. Ahrefs
-
Backlink analysis
-
Keyword research
-
Traffic insights
5. Types of Marketing Dashboards
1. Executive Dashboard
-
High-level KPIs
-
ROI-focused
-
For decision-makers
2. Operational Dashboard
-
Daily performance tracking
-
Campaign monitoring
3. Analytical Dashboard
-
Deep data analysis
-
Trends and insights
4. Campaign Dashboard
-
Specific campaign performance
-
Ad tracking
6. Features of a Great Marketing Dashboard
1. Real-Time Data
Up-to-date insights for quick decisions.
2. Customization
Tailor dashboards to your needs.
3. Multi-Channel Integration
Connect data from various platforms.
4. Data Visualization
Charts, graphs, and heatmaps.
5. Automation
Automated reporting and alerts.
7. How to Build a Marketing Dashboard
Step 1: Define Your Goals
-
Increase traffic
-
Generate leads
-
Improve ROI
Step 2: Choose Metrics
Select KPIs relevant to your goals.
Step 3: Select Tools
Use tools like Google Looker Studio or Power BI
Step 4: Integrate Data Sources
-
Website
-
Social media
-
Ads platforms
Step 5: Design Dashboard
Use simple and clear visuals.
Step 6: Analyze & Optimize
Continuously improve performance.
8. Best Practices for Marketing Dashboard Analytics
Keep It Simple
Avoid clutter—focus on key metrics.
Use Visual Hierarchy
Highlight important data.
Update Regularly
Ensure data accuracy.
Focus on Actionable Insights
Don’t just display data—interpret it.
Segment Data
Analyze by audience, channel, or campaign.
9. Common Mistakes to Avoid
Tracking Too Many Metrics
Focus on what matters.
Ignoring Data Quality
Incorrect data leads to poor decisions.
Lack of Context
Data without context is meaningless.
Not Acting on Insights
Insights are useless without action.
10. Benefits of Marketing Dashboard Analytics
Improved Decision-Making
Data-driven strategies.
Increased Efficiency
Save time with automation.
Better Campaign Performance
Optimize based on insights.
Enhanced Collaboration
Teams work with shared data.
11. Advanced Dashboard Strategies (2026 Trends)
AI-Powered Analytics
Predictive insights and automation.
Real-Time Personalization
Dynamic dashboards for users.
Cross-Channel Attribution
Understand customer journeys.
Voice & Visual Analytics
Voice-based data queries.
12. Marketing Dashboard Use Cases
1. SEO Monitoring
Track rankings and organic traffic.
2. Ad Campaign Optimization
Analyze ROI and conversions.
3. Social Media Growth
Measure engagement and reach.
4. Sales Funnel Tracking
Monitor leads and conversions.
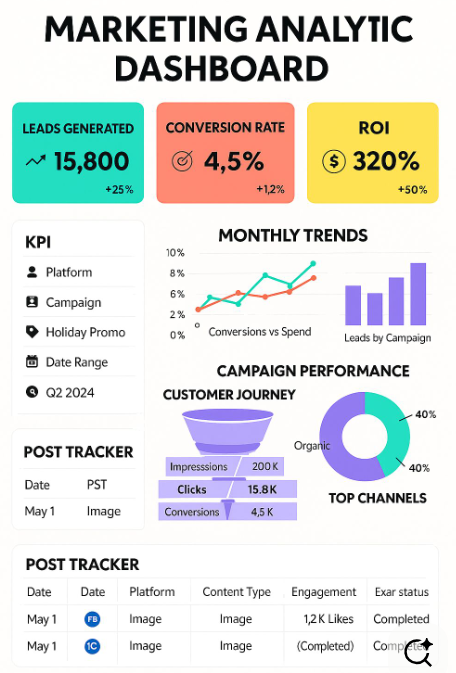
13. Example Dashboard Setup
Dashboard Layout:
-
Top: Key KPIs
-
Middle: Channel performance
-
Bottom: Detailed analytics
Metrics Example:
-
Traffic: 10,000/month
-
Conversion Rate: 3%
-
ROAS: 4x
14. Step-by-Step Implementation Plan
Week 1:
-
Define goals and KPIs
Week 2:
-
Select tools and integrate data
Week 3:
-
Build dashboard
Week 4:
-
Test and optimize
15. Future of Marketing Dashboard Analytics
The future is automated, intelligent, and predictive.
Key Trends:
-
AI-driven insights
-
No-code dashboards
-
Real-time decision-making
-
Deeper personalization
16. Conclusion
Marketing dashboard analytics is no longer optional—it’s essential for success in 2026. Businesses that leverage data effectively gain a competitive advantage.
Key Takeaways:
-
Use dashboards to centralize data
-
Focus on actionable insights
-
Choose the right tools
-
Continuously optimize
With the right dashboard, you can transform raw data into powerful growth strategies.
Final Tip: